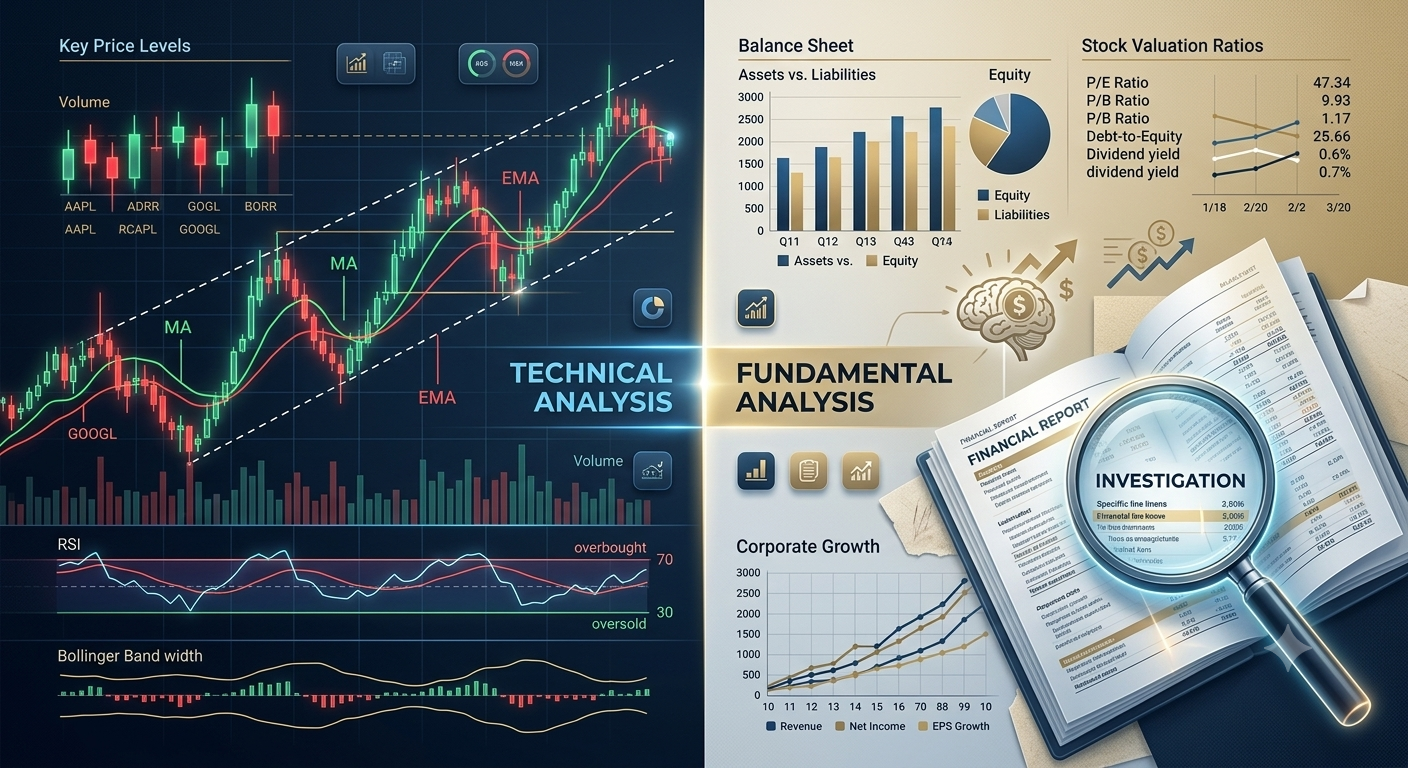
If you want to learn share market analysis, understanding both fundamentals and technicals step-by-step is essential for consistent success. The stock market can look complicated when you are just starting out. You may hear terms such as technical analysis, fundamental analysis, support, resistance, P/E ratio, candlestick patterns, earnings, and market trends. However, learning these concepts step by step can make stock market investing and trading easier to understand.
Step-by-Step Guide to Learn Share Market Analysis
Fundamental analysis is the process of studying a company’s financial and business performance to understand its underlying value and financial condition.
Before buying shares of a company for long-term investment, investors commonly look at factors such as revenue, profit, debt, cash flow, assets, and business growth.
Some important fundamental factors include:
- Revenue and sales growth
- Net profit and profit margins
- Earnings per share (EPS)
- Price-to-Earnings (P/E) ratio
- Debt-to-equity ratio
- Return on Equity (ROE)
- Cash flow
- Dividend history
- Promoter or management information
- Industry and business outlook
For example, if a company’s revenue and profits have been growing consistently while its debt remains manageable, an investor may consider these factors as part of their overall research.
However, no single ratio can determine whether a stock is suitable for investment. Fundamentals should be studied together with the company’s business, industry, valuation, and other relevant information.
How to Learn Share Market Analysis Step by Step
Technical analysis focuses mainly on price and trading-volume data. Traders use charts and indicators to study market trends and identify possible entry and exit areas.
Some common technical analysis concepts include:
- Candlestick patterns
- Support and resistance
- Trendlines
- Moving averages
- RSI
- MACD
- Volume analysis
- Breakouts and breakdowns
- Chart patterns
For example, a trader may use support and resistance levels to identify areas where the price has previously reacted. Moving averages can also be used to study price trends.
Technical analysis does not guarantee that a trade will be profitable. Market prices can move unexpectedly because of news, economic conditions, company announcements, or other factors.
How To Learn Share Market Technicals And Fundamentals Step By Step
1. Start With Stock Market Basics
Before learning advanced technical indicators or financial ratios, understand the basic structure of the stock market.
Learn what stocks, indices, exchanges, IPOs, dividends, market capitalization, and brokerage accounts are.
You should also understand the difference between investing and trading.
Investing generally focuses on holding an asset for a longer period, while trading usually involves shorter-term buying and selling based on a particular strategy or market setup.
2. Learn How To Read Financial Statements
For fundamental analysis, financial statements are extremely important.
Start by learning the three major financial statements:
Profit and Loss Statement: Shows a company’s revenue, expenses, and profit over a period.
Balance Sheet: Shows assets, liabilities, and shareholders’ equity.
Cash Flow Statement: Shows how cash moves through operating, investing, and financing activities.
Once you understand these statements, start comparing a company’s performance over multiple years rather than focusing only on one quarter.
3. Learn Important Fundamental Ratios
After understanding financial statements, learn commonly used ratios.
For example, the P/E ratio compares a company’s share price with its earnings per share. The debt-to-equity ratio helps assess the relationship between a company’s debt and shareholders’ equity.
ROE can provide information about how effectively a company generates profit from shareholders’ equity.
Remember that ratios should generally be compared with similar companies or the relevant industry rather than viewed in isolation.
4. Learn Candlestick Charts
Once you understand the basics, begin technical analysis with candlestick charts.
A candlestick generally shows four important price points:
- Open
- High
- Low
- Close
Learn basic patterns such as Doji, Hammer, Engulfing, and other commonly discussed candlestick formations.
Do not try to memorize dozens of patterns at once. Learn a few concepts and understand how price behaves around important levels.
5. Understand Support and Resistance
Support and resistance are among the basic concepts of technical analysis.
Support refers to a price area where buying interest has previously appeared, while resistance refers to an area where selling pressure has previously appeared.
These are zones rather than guaranteed exact price points. A level can also break when market conditions change.
6. Learn a Few Technical Indicators
Beginners often make the mistake of adding too many indicators to one chart.
Instead, start with a few commonly used tools such as:
- Moving averages
- RSI
- MACD
- Volume
Learn what each indicator measures, what its limitations are, and how traders typically use it.
The objective should be to understand price and volume first rather than relying completely on indicators.
Practice With Paper Trading
One of the most useful ways to learn is through practice.
Instead of immediately risking real money, beginners can use paper trading or maintain a trading journal.
Record:
- Stock name
- Entry price
- Exit price
- Reason for the trade
- Technical setup
- Fundamental factors
- Stop-loss level
- Result
- Mistakes or lessons
After recording multiple trades, you can review whether your strategy is actually working according to your defined rules.
Combine Technicals And Fundamentals
Technical and fundamental analysis serve different purposes.
Fundamental analysis can help you understand the company’s business and financial position, while technical analysis can help you study price behavior and market trends.
For example, an investor may first research a company’s financial performance and business prospects. Technical analysis can then be used as an additional tool to study the stock’s price structure and potential entry timing.
This approach can help you build a more structured research process instead of making decisions based only on social media tips or market rumours.
Create A Daily Learning Routine
Consistency is more important than trying to learn everything in one day.
A beginner can create a simple routine:
30 minutes: Learn one stock market concept.
30 minutes: Study one company’s financial statements.
30 minutes: Analyze charts and price movements.
15 minutes: Read important market or company news.
15 minutes: Maintain your trading or investing journal.
Following a routine for several months can help you develop a stronger understanding of the market.
Avoid Common Beginner Mistakes
While learning the stock market, avoid blindly following tips from Telegram groups, social media influencers, or friends.
Do not assume that a stock will rise simply because someone predicts a target price.
Avoid using borrowed money for trading, especially while you are still learning. Also, do not risk money that you cannot afford to lose.
Most importantly, remember that technical and fundamental analysis are tools for research, not guarantees of future returns.
Final Thoughts
Learning the share market takes time, practice, and discipline. If you are searching for How To Learn Share Market Technicals And Fundamentals, start with the basics and gradually move toward financial statements, fundamental ratios, candlestick charts, support and resistance, indicators, and practical chart analysis.
Do not focus only on making quick profits. Focus on understanding why a company may be financially strong or weak and why a stock’s price may behave in a particular way.
With consistent learning, paper trading, proper research, and a well-maintained journal, beginners can develop a more structured approach to understanding the stock market.
Disclaimer: This article is for educational and informational purposes only. It is not financial or investment advice. Stock market investments and trading involve risk, and you should conduct your own research or consult a qualified financial professional before making investment decisions.